· David Cruz · ABA Best Practices · 6 min read
Is Your ABA Program Working? How to Read Skill Acquisition Data at a Glance
You have the data. But with 10+ programs per client, how do you quickly tell which ones are working and which need attention? Here's a framework for at-a-glance program analysis.
Key Takeaways
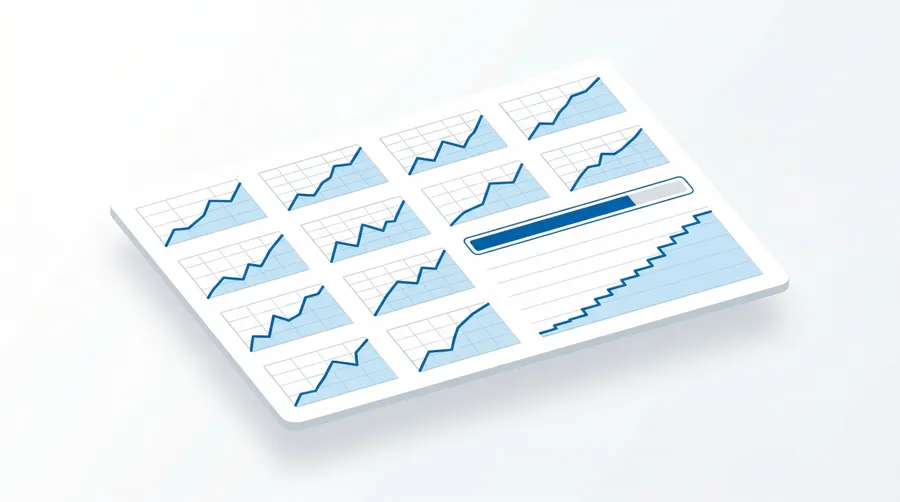
Visual analysis is the primary method for evaluating ABA programs, but reviewing individual graphs one at a time doesn’t scale. When you’re managing 10+ programs per client across a full caseload, you need a faster way to spot which programs are progressing and which ones are stalled. The three properties to evaluate are level, trend, and variability. TallyFlex provides a Program Analytics pane that combines health summaries with cumulative mastery step charts, target comparisons, and individual target graphs into a single view - so you can identify problems in seconds instead of minutes.
The 10-Program Problem
It’s Tuesday afternoon. You have 30 minutes before your next session to review client data and prepare for a parent meeting. This client has 12 active programs spanning manding, social skills, daily living, and academics. Each program has 3-8 targets at various stages.
You open the first program, scroll through the graph, evaluate the trend, check mastery progress. Move to the second program. Then the third. By program six, you’re running out of time. By program eight, you’re skimming. Programs nine through twelve? You’ll “get to those next time.”
This isn’t a time management problem. It’s an information architecture problem. When the only way to assess a program is to examine each target’s graph individually, the process doesn’t scale to real caseloads.
Visual Analysis: The Primary Method
Before discussing how to speed up analysis, it’s worth grounding in what good analysis looks like.
Cooper, Heron & Heward identify visual analysis as the primary method for evaluating behavior change in ABA. Unlike statistical analysis, visual analysis relies on direct inspection of graphed data to identify meaningful patterns. The three core properties BCBAs evaluate are:
Level
The average value of the data within a phase. Is the learner performing at 20%, 60%, or 90%? Level tells you where performance sits right now.
Trend
The overall direction of the data over time. An upward trend in skill acquisition data suggests learning is happening. A flat trend suggests the teaching procedure isn’t producing change. A downward trend in acquisition data is a red flag.
Variability
How spread out the data points are. Low variability (data points clustered close together) suggests stable, predictable performance. High variability (data points scattered widely) suggests inconsistency - which could signal unclear definitions, inconsistent implementation, or a skill that hasn’t truly consolidated.
What a Stalled Program Looks Like
A stalled program typically shows:
- Flat trend - No upward movement over 3-5+ sessions
- High variability - Performance bouncing between 30% and 70% with no clear direction
- No mastery progress - No targets advancing toward mastery criteria
- Same phase for weeks - The learner is stuck on the same STO without advancement
This pattern tells you something needs to change. The question is what - but the first step is recognizing the pattern quickly enough to act on it.
What a Successful Program Looks Like
Strong acquisition data shows:
- Upward trend - Consistent improvement over time
- Low variability - Tight data paths, especially in recent sessions
- Regular mastery - Targets meeting criteria and advancing on a reasonable timeline
- Phase changes - The learner moves through STOs at an expected pace
When to Modify a Program
The general guidance is: if a learner shows no meaningful progress after 3-5 sessions at the same level, it’s time to consider changes. “No meaningful progress” means:
- Level hasn’t increased
- Trend is flat or declining
- No targets approaching mastery criteria
The supervising BCBA should consider these modifications:
- Changing the teaching procedure - Different prompt strategies, different materials, different reinforcement schedules
- Adjusting mastery criteria - Criteria may be too ambitious for this stage of learning
- Breaking the skill into smaller steps - The current STO may require prerequisites the learner hasn’t fully acquired
- Reviewing implementation fidelity - The program may be well-designed but inconsistently implemented
How TallyFlex Makes Program Analysis Fast
TallyFlex’s Program Analytics pane - part of an ABA data collection app built for visual analysis - puts everything you need for quick program assessment in one place - no more opening individual target graphs one at a time.
Health Summary
A progress bar showing the mastered count and percentage (e.g., “2/4 targets mastered 50%”), giving you an instant read on how far the program has progressed. Below the progress bar, a cumulative mastery step chart shows when each target was mastered over time - each step up represents a target meeting mastery criteria.
A program with 1/8 targets mastered after 8 weeks of treatment looks very different from one at 6/8. The health summary makes that visible instantly. It also answers the question: “Is this program producing mastery at a consistent rate?” A program with a long flat section followed by a cluster of mastery events might indicate an initial teaching problem that was eventually resolved.
Target Comparison Chart
Compare performance across all targets within the same program, side by side. Instead of opening each target’s graph individually, you see all targets on a single chart.
This reveals patterns that individual graphs miss:
- One target dramatically lower than others may indicate a prerequisite skill deficit
- All targets plateau at the same time may suggest a systemic issue (staffing changes, environment changes, reinforcement problems)
- A single target progressing much faster than others may be too easy and could be graduated sooner
Individual Target Graphs
Tap any target in the program analytics pane to open its detailed graph, showing the full data history with trend lines. This lets you drill into specific targets that the comparison chart flagged as concerning - examining level, trend, and variability for that individual skill.
What to look for in individual target graphs:
| Pattern | What It Means | Action |
|---|---|---|
| Upward slope | Target progressing | Continue current procedures |
| Flat line | Target stalled | Review after 3-5 sessions |
| Downward slope | Target regressing | Investigate immediately |
| Erratic zigzag | High variability | Check implementation fidelity |
The combination of the target comparison chart (all targets together) and individual target graphs (deep dive) gives you both breadth and depth without leaving the program analytics pane.
Identifying Programs That Need Attention
The fastest way to triage a caseload in TallyFlex:
- Open the program analytics - check the target comparison chart for flat or declining patterns
- Check health summaries - programs with few mastered targets relative to time in treatment need review
- Drill into flagged programs - use the health summary’s step chart to see when learning stalled
- Compare targets - use the target comparison chart to isolate which specific targets are the problem
This workflow takes minutes, not the 30+ minutes of opening individual target graphs.
Putting It Into Practice
Effective program analysis doesn’t require more time. It requires better information architecture. When you can see level, trend, and variability across all programs at once, you make faster and better clinical decisions.
The framework:
- Review target comparison charts weekly - catch stalled programs before they become 6-week problems
- Review health summaries - verify programs are producing mastery at expected rates
- Use health summary step charts for programs that look behind schedule - identify when learning slowed
- Modify quickly - the 3-5 session guideline means waiting too long costs learner progress
What’s Next?
- Program Analytics - Detailed guide to TallyFlex’s analytics pane
- Working with Graphs - Understand tracker-level graphs and data visualization
- Auto-Progression - How TallyFlex automatically advances phases when mastery criteria are met
Your data is only as useful as your ability to act on it. TallyFlex gives you the at-a-glance view that turns raw data into clinical decisions - so no program goes unreviewed because you ran out of time.