Scatterplot Analysis
Find time-of-day patterns across behavior-reduction trackers and include scatterplots in reports.
Requires: Paid plan for regular clients; demo clients can show the feature for exploration
Use Scatterplot Analysis when the daily trend is not enough and you need to see when behavior is happening across the day.
Tracker Detail View
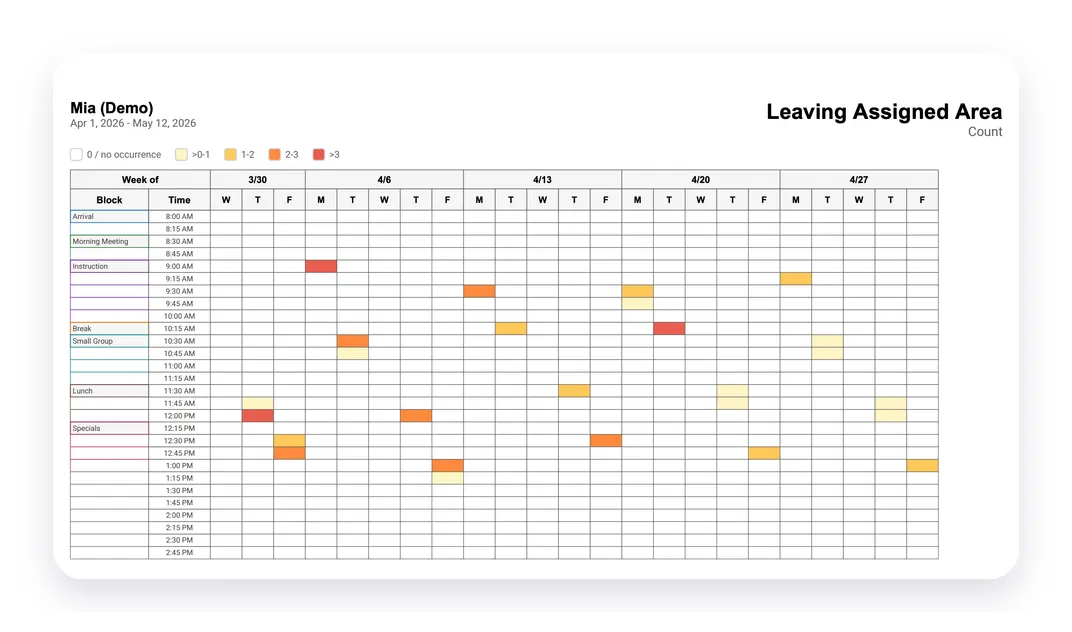
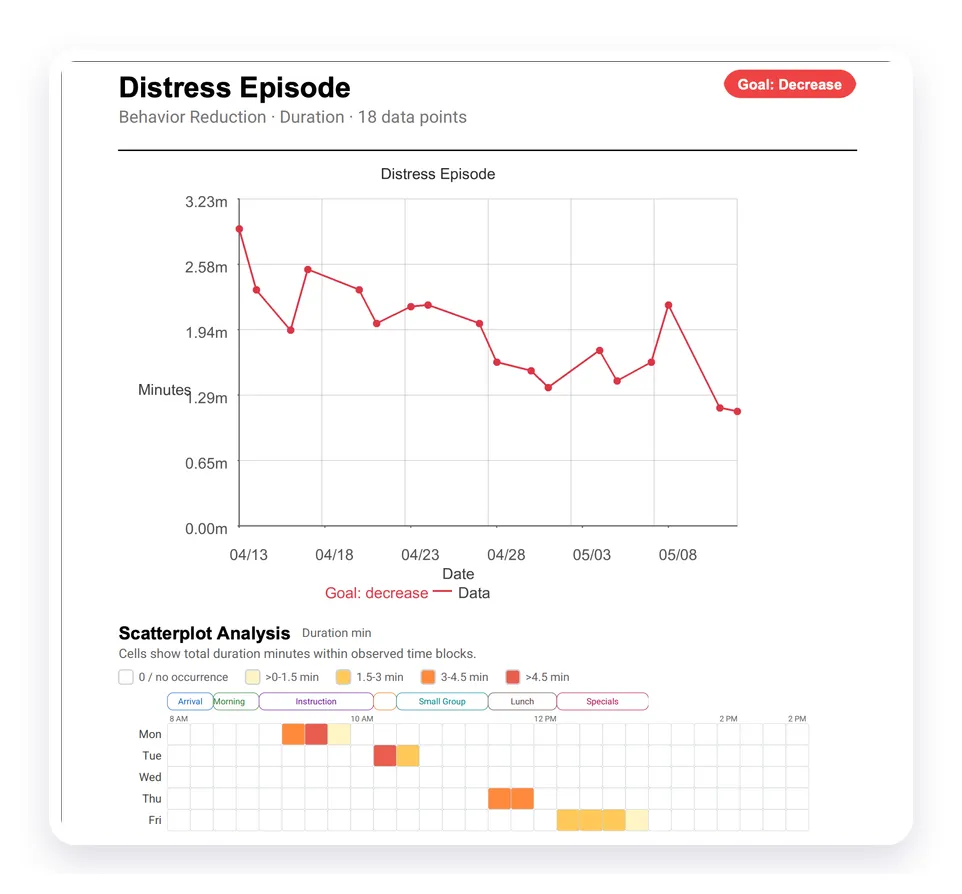
Supported behavior-reduction trackers show a scatterplot below the regular progress graph. The same card can switch between date rows, weekday summaries, and the metric that best fits the tracker.
![]()
Colored cells show where the behavior occurred during each time window. The legend shows the measurement unit for that tracker.
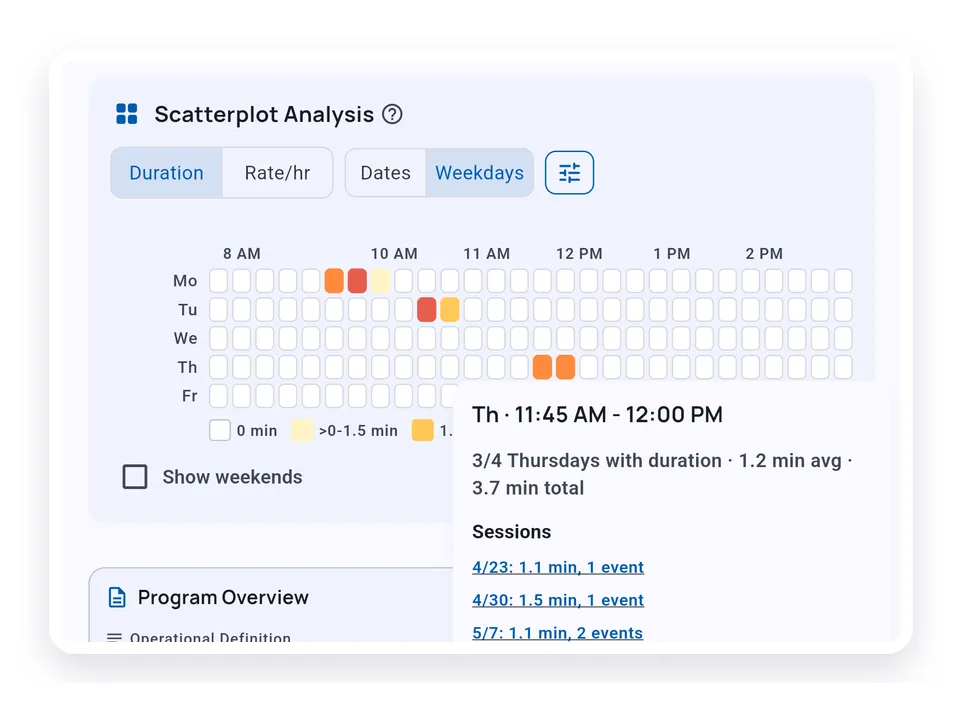
Tap a cell when you need the dates behind a pattern. If the cell is connected to session records, the detail sheet links back to those sessions.
Activity Blocks
Activity blocks turn the day into meaningful labels such as Arrival, Instruction, Lunch, or Specials.
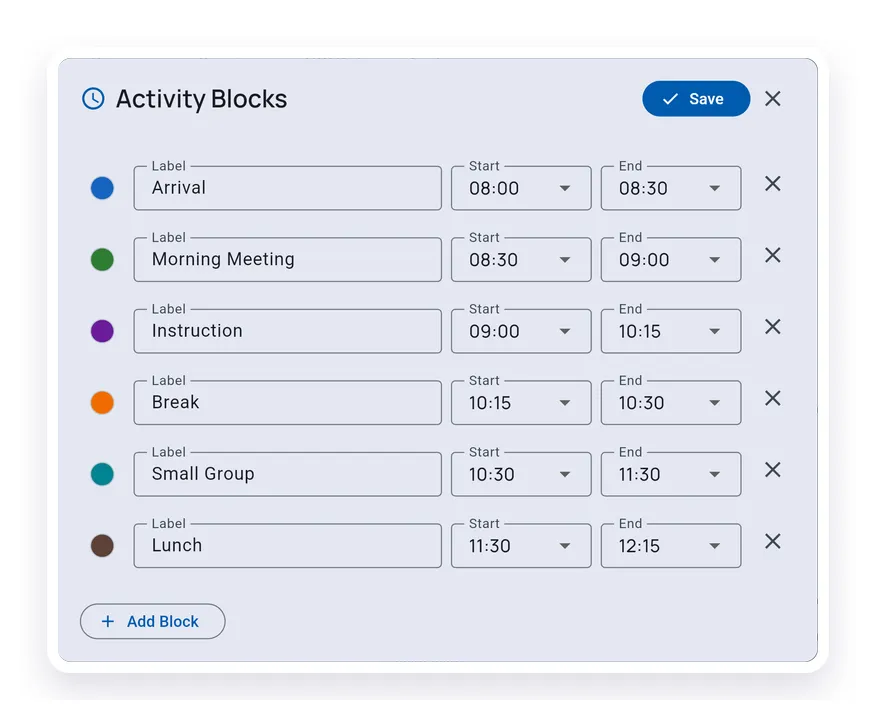
Use blocks when the schedule matters more than raw clock time. Start with a preset or edit the blocks directly.
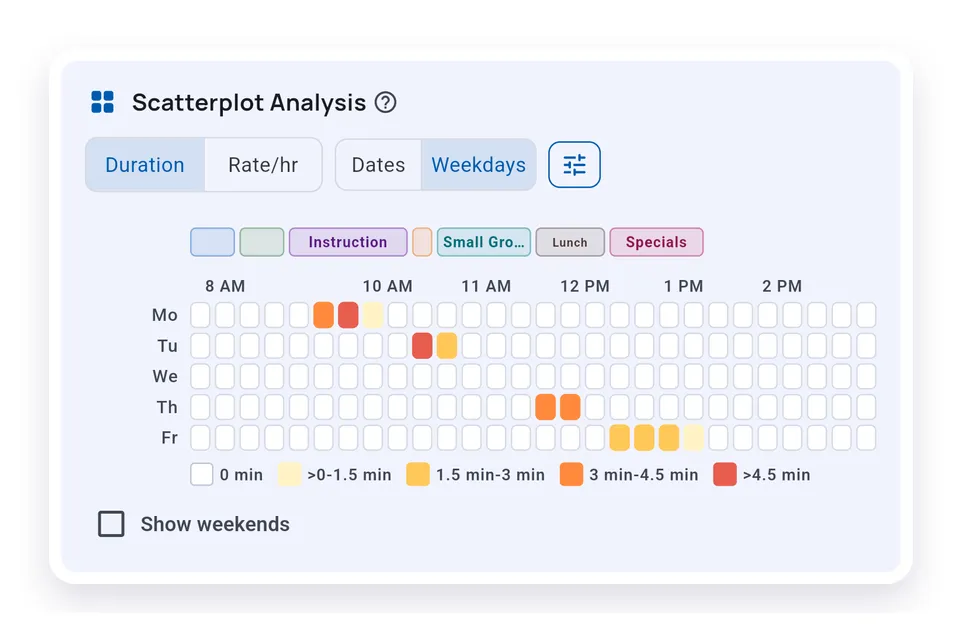
The block labels sit above the same 15-minute cells, making the schedule context easier to read without changing the underlying time windows.
Analysis Tab
The client Analysis tab lets you compare multiple selected behavior-reduction trackers in one place.
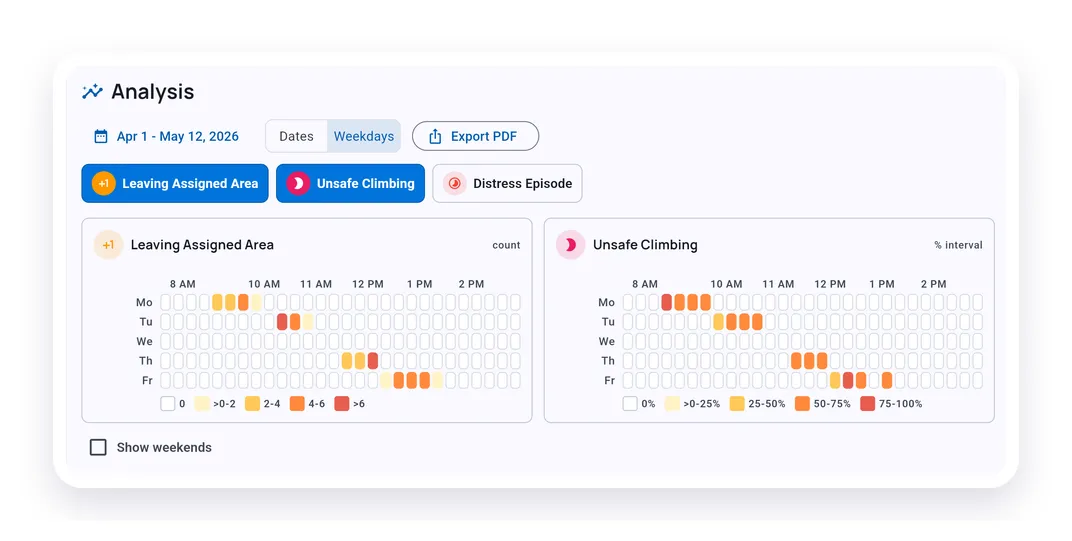
Adjust the date range, switch between Dates and Weekdays, choose which trackers to include, and hide or show weekends.
Export Options
The Analysis tab export creates a scatterplot-only PDF from the current selection.
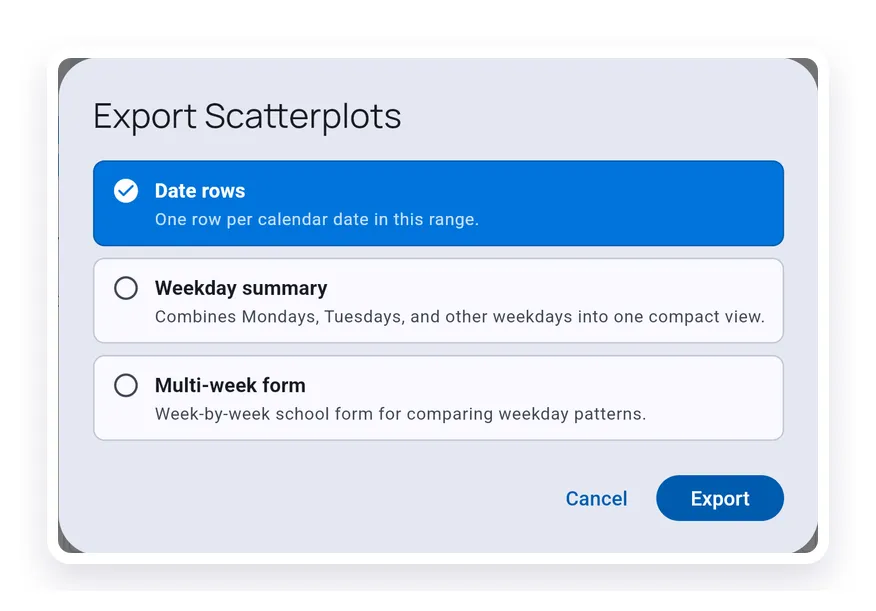
Use Date rows for day-by-day review, Weekday summary for compact pattern review, and Multi-week form when you want a printable school-style comparison.
Reports
Generate Report can include Scatterplot Analysis alongside the regular graph for selected trackers.
The report keeps the date range, tracker name, metric unit, and legend with the scatterplot so the visual can be read outside the app.
What’s Next?
- Working with Graphs - Customize regular tracker graphs
- Generate Report - Create client reports with graphs and selected analysis sections
- Report Statistics - Understand how report metrics are calculated
Need Help?
Questions about scatterplot analysis? Email support@tallyflex.com for assistance.