Task Analysis Reports
Read heat maps and prompt distribution charts for task analysis trackers.
Task analysis trackers include the standard progress line graph (see Working with Graphs) plus two task-analysis-specific visualizations: the heat map and prompt distribution chart.
New to task analysis? Start with Task Analysis Setup to configure your trackers.
Heat Map (Step-by-Step Progress)
The heat map displays prompt levels as colors across steps (rows) and sessions (columns).
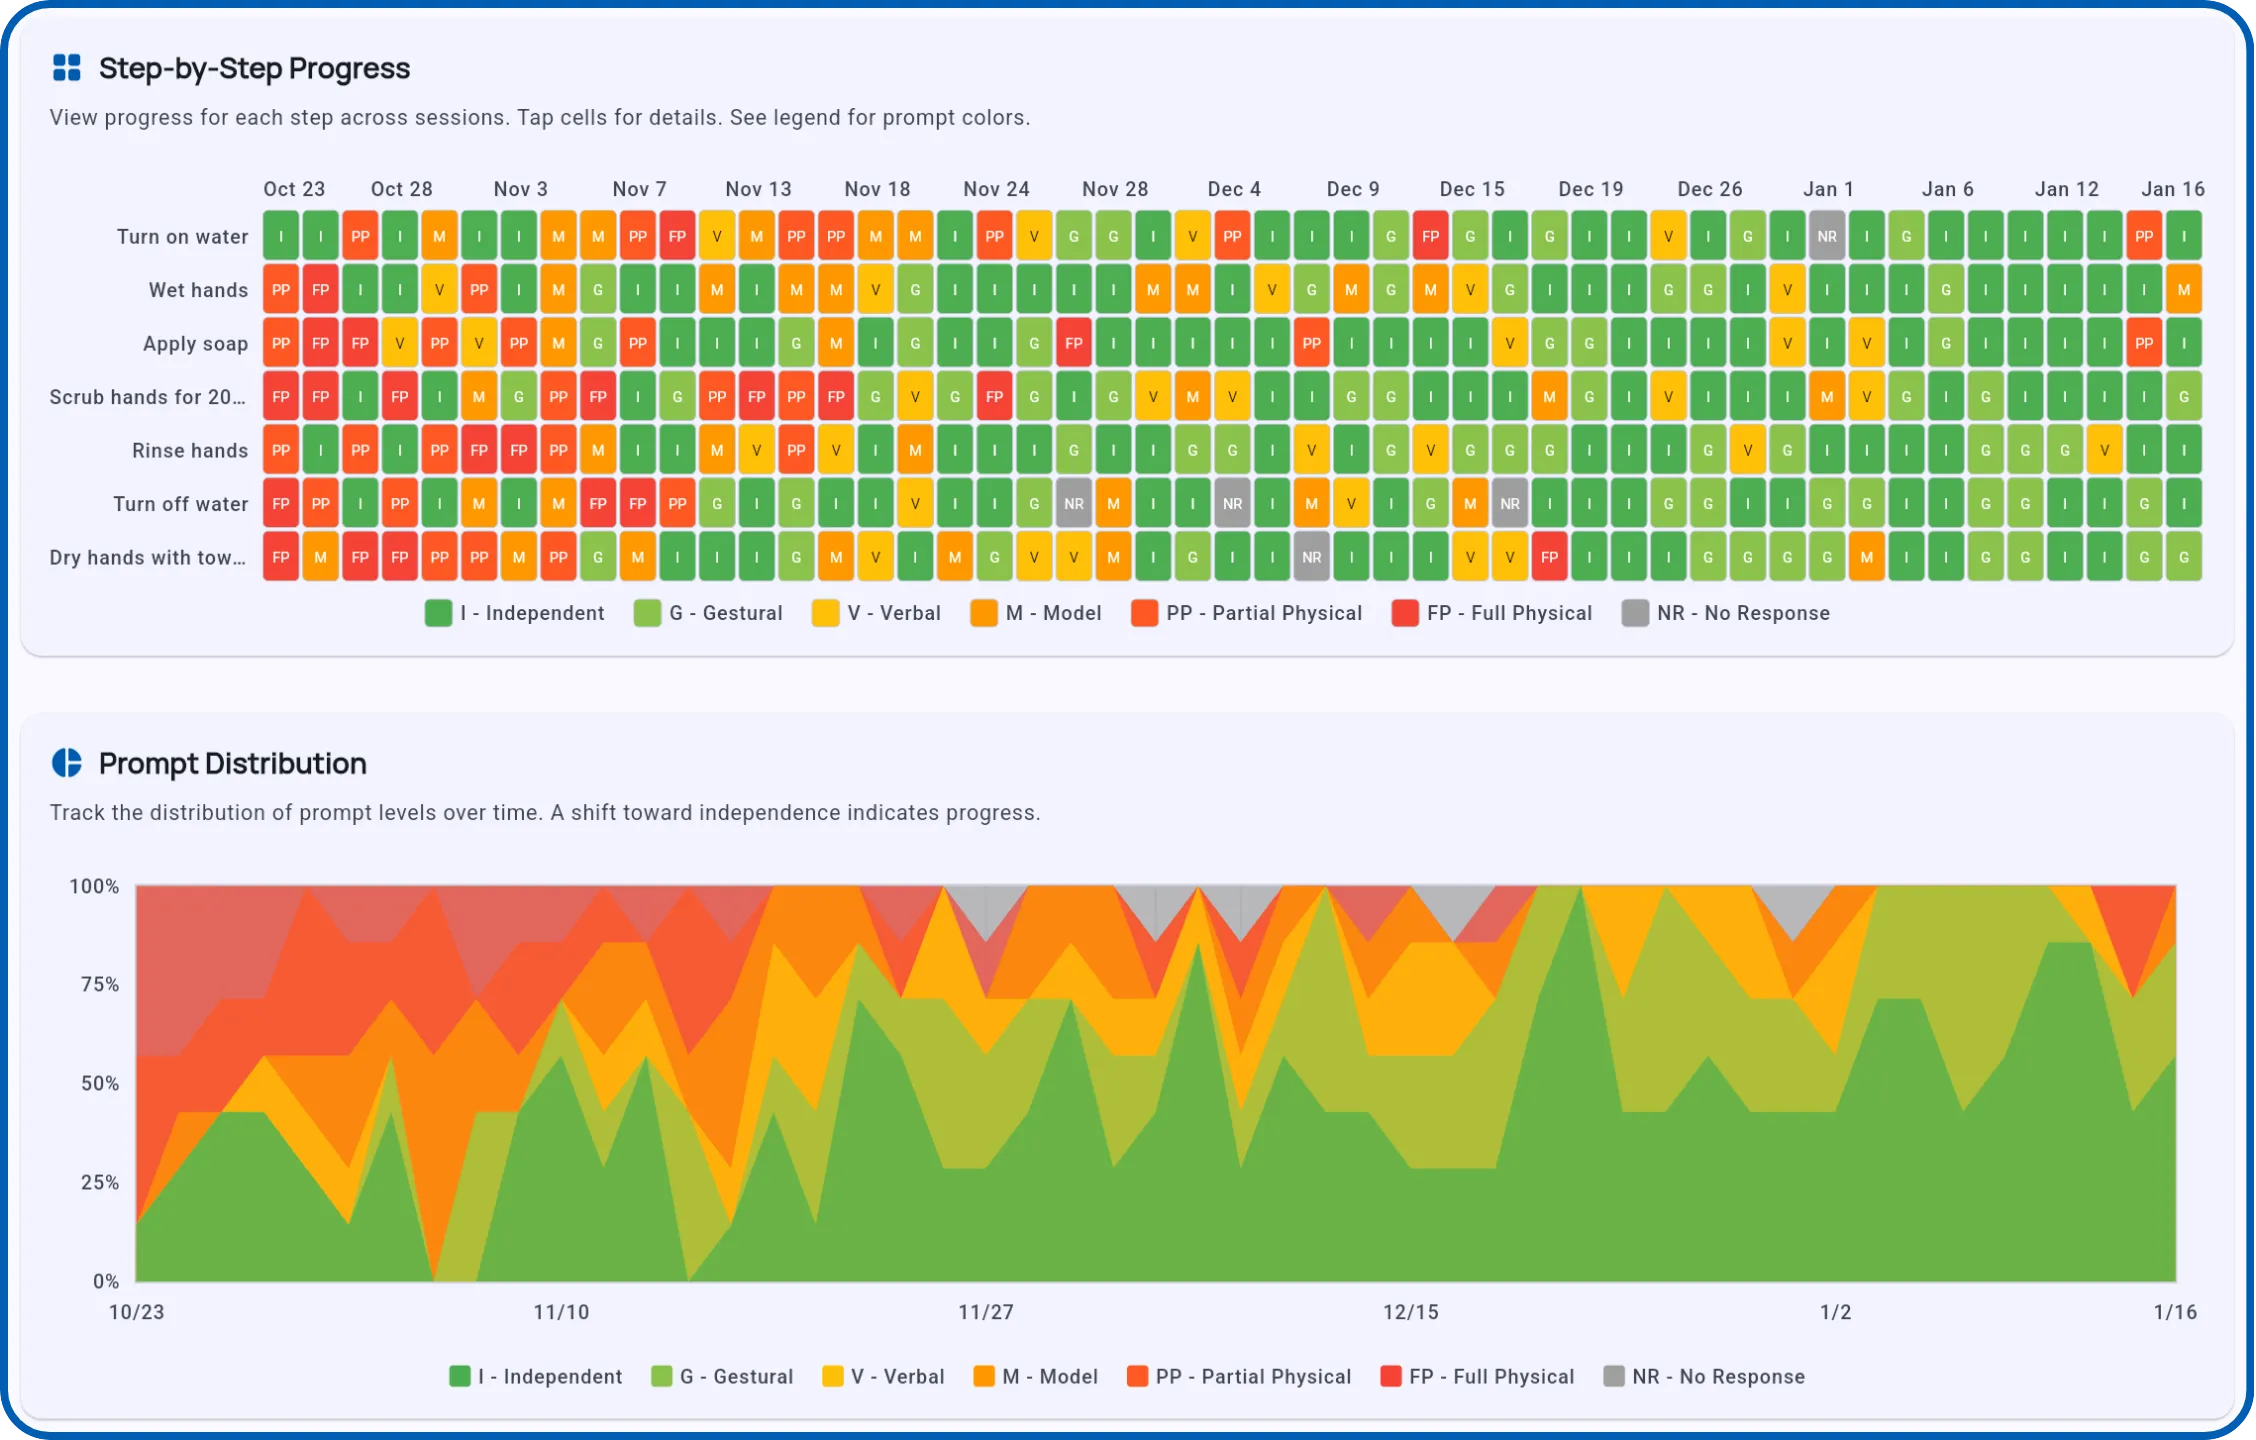
Layout:
- Rows = Steps in the task chain
- Columns = Sessions (most recent on right)
- Cells = Color-coded prompt levels
Colors:
- Green (I) - Independent
- Yellow (G, V) - Minimal prompting
- Orange (M, PP) - Moderate prompting
- Red (FP) - Full physical
- Grey (NR) - No response
Prompt Distribution Chart
Shows the breakdown of prompt levels across all steps for a selected time period - useful for comparing early acquisition vs. maintenance phases.
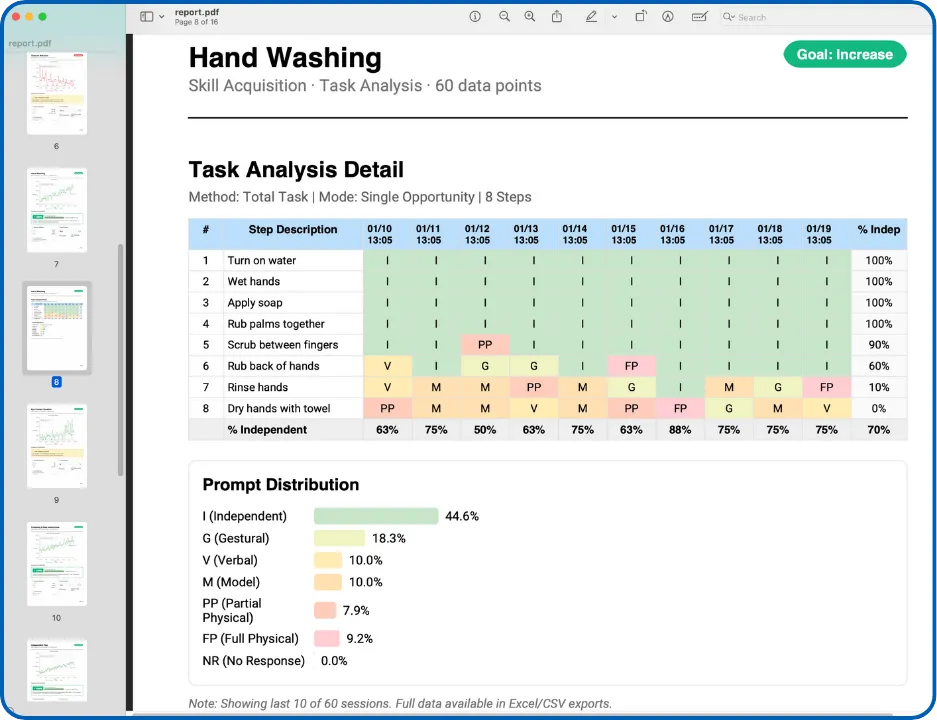
Exporting Task Analysis Data
Export task analysis data as PDF, Excel, or CSV. PDF reports include the step-by-step detail table and prompt distribution chart.
Learn more in Generate Reports.
What’s Next?
- Task Analysis During Sessions - Learn how to score during active therapy
- Task Analysis Setup - Configure trackers and mastery criteria
- Working with Graphs - Master all graph customization features
- Generate Reports - Create professional PDF reports
Need Help?
Questions about task analysis reports? Email support@tallyflex.com for assistance.