Generate Report
Choose the report that fits, reuse reporting periods, and add your reporting name or logo.
Open Generate Report
Generate Report is available on Solo and Teams. Free includes Basic Excel and CSV Export.
From a client or student profile, open the gear menu and choose Generate Report.
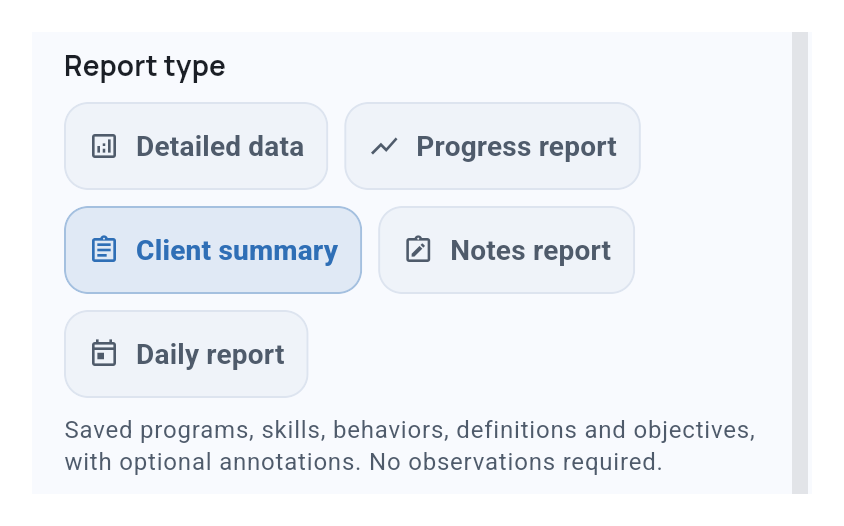
Choose the report that fits
- Detailed data - Choose graphs, summaries, statistics, and notes for a PDF, or export structured data as Excel or CSV.
- Progress report - Review observed progress by week or month in a PDF.
- Client summary - Share saved programs and targets in a PDF, even before collecting data. No date range needed.
- Notes report - Share saved notes from completed service records in a PDF, with their current review status.
- Daily report - Bring one day’s service records, data summaries, timeline events, and notes into one PDF.
For a caseload Daily report, use Daily Export on the Clients page. It includes people you can access who have data that day, with each person starting on a separate page.
Daily reports also include observations added after a visit.
PDF example · Select to view full size
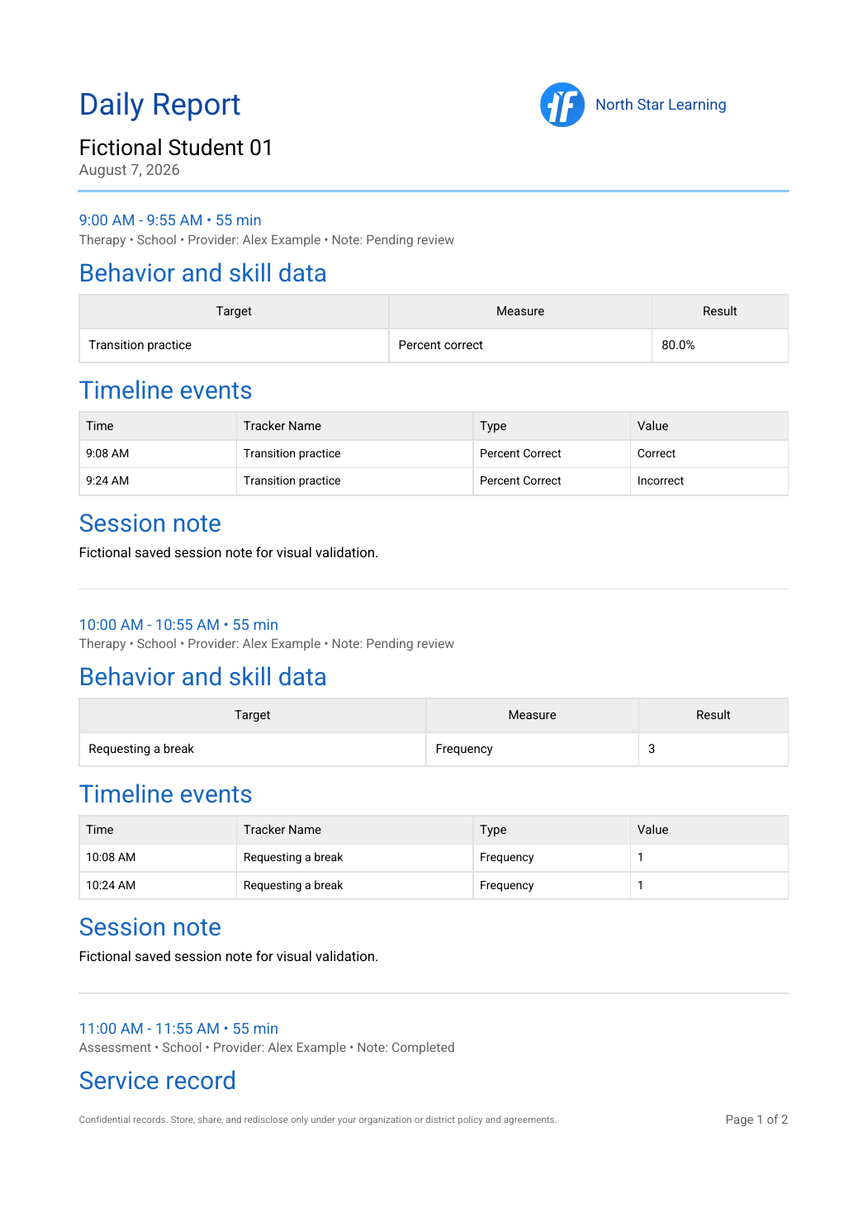
Choose supporting detail
For Daily report and caseload Daily Export, turn off Include supporting details for a simpler summary table. Your results stay visible, and other report sections stay the same. The option starts on for each report. You can also use it when exporting one Service Record.
In Detailed data, Include task analysis and prompt details controls those detailed sections.
Include objectives in Progress report
Turn on Include objectives in Progress report to add objective text, criteria, and any benchmark dates.
- Current only includes each selected tracker’s current objective when you generate the report.
- Current and mastered also includes objectives recorded as mastered within the reporting period. Pending objectives are excluded.
Benchmark is a planning date; recorded mastery dates determine which mastered objectives are included. Set or change a benchmark date.
Keep context with the graph
Detailed data and Progress report PDFs keep annotations, such as schedule changes, with the graph. The Annotations list carries their full details.
In a Progress report, a marker identifies the week or month containing the annotation. Use the list for its exact date and time.
See Working with Graphs to add and review annotations.
Reuse reporting periods
Save a reporting period for dates you use often, such as a grading period. Solo users manage their own periods; on Teams, owners and admins manage shared periods. You can also choose a custom date range.
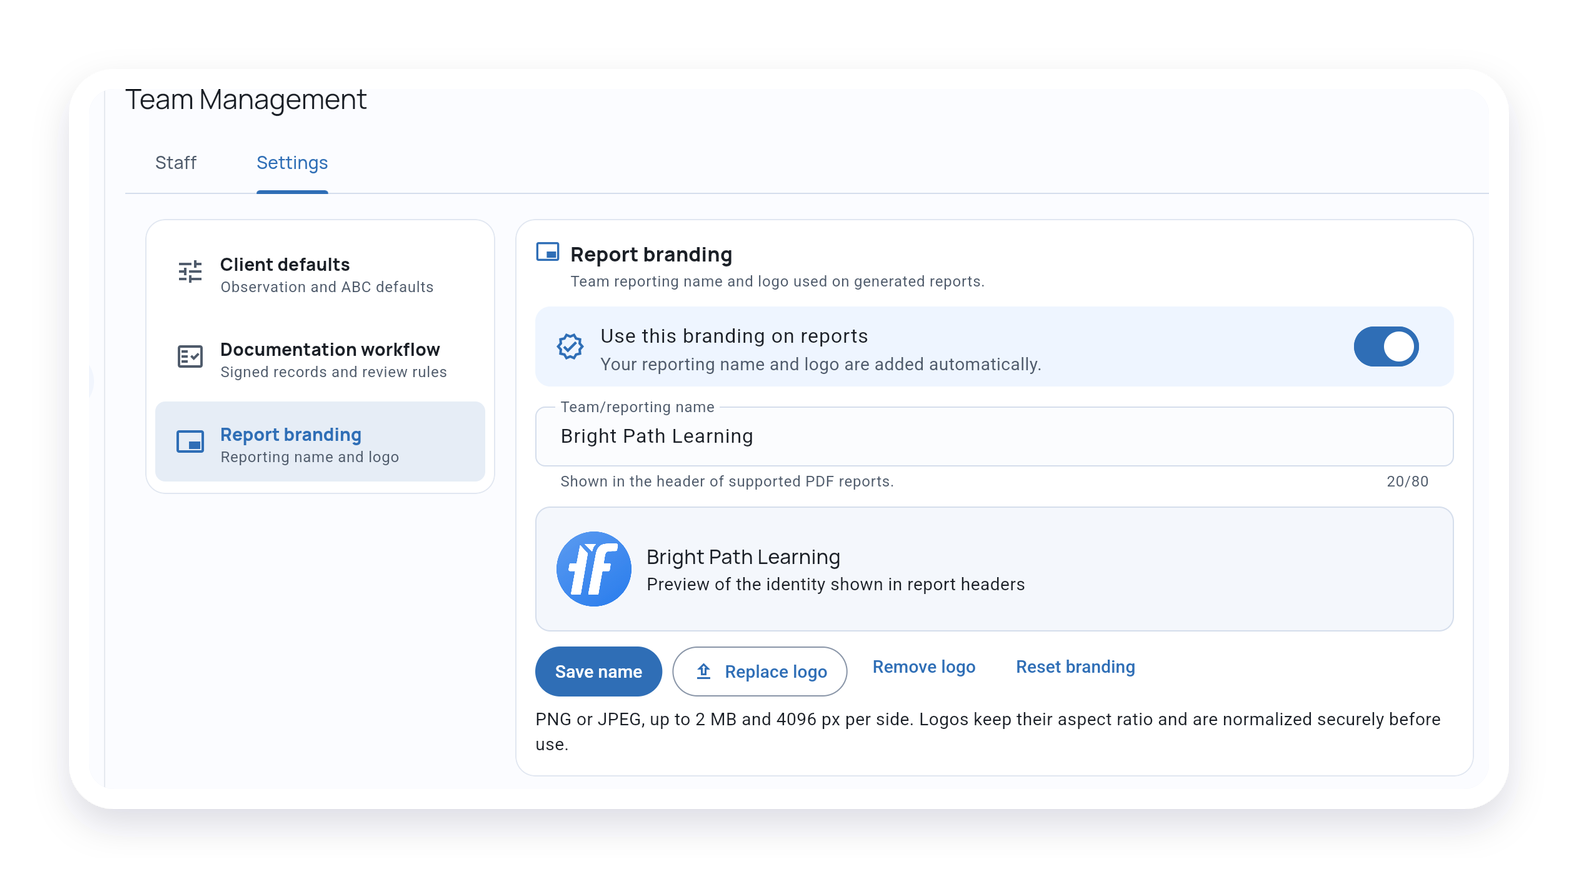
Add a reporting name and logo
Add your name and logo to supported PDF headers in account settings. On Teams, owners and admins manage this in team settings.
Generate and share the report
Choose Generate report when your selections are ready.
Share reports only with people authorized to receive the client or student’s information.
What’s Next?
- ABA Data Reports - See the reporting workflows at a glance
- Basic Export - Free Excel and CSV export for all plans
- Signed Service Records - Include signature details in eligible PDFs
- Observation Settings - Filter Detailed data output by setting or staff
- Scatterplot Analysis - Include time-of-day behavior patterns in Detailed data reports
Need Help?
Questions? Email support@tallyflex.com without client or student identifying details.